

Bring Quarto to life with {webR}
Quarto can be frustrating: you read a report, but cannot interact with it! You're browser doesn't speak R,so there is nothing you can change.
This lesson introduces webR, a tool that lets you run R code directly in the browser.
Now, your readers can interact with your work on the spot! 🔥
Problem: Your Quarto report is Static 🙈
Ever been there? You're reading a Quarto report and spot a few adjustments you'd like to make for a different take on the analysis.
For example:
This is usually when people start building application using Shiny!
But this is complicated and requires a slow, expensive, annoying server to be setup.
- The analysis was run on group
35, but you'd love to see the results for group87. - You want to try a slightly different regression model to see if it fits better.
- You suspect some data points are wrong and want to remove them from the analysis.
Normally, you'd have to get the source code and rerun the analysis on your machine.
Not so fast!
webR can make your life easier.
🔥 webR: Run R in Your Browser
Normally, to run R code, you’d need to install R on your machine.
webR is a new technology that allows web browsers (like Firefox and Chrome) to understand and execute R code. With webR, you can simply type plot(1,1) in your browser, and it will generate a plot just like RStudio!
Thanks to webR, your browser just learnt a new foreign language: R.
There are now 2 solutions to our problems:
1️⃣ Interactive code chunks with quarto-webr
Thanks to quarto-webr , you can now embed interactive R code chunks directly into your reports.
In the demo below, I modify a variable in the first code chunk, click Run Code, my browser reads the code and updates the result!
Once again, this is happening INSIDE my browser!! 🔥
The creators of quarto-webr made a very good intro video, but I know you're in a hurry so here is how to make it at home.
2️⃣ UI components with shiny-live
Imagine you have 100 groups in your dataset.
You could generate 100 charts using a loop in your report, but that would make it tedious and overwhelming to read 😔.
With shiny-live, you can create a dropdown menu with all 100 options. Users can select the group they're interested in, and the corresponding chart is generated right in the browser using R!
I've done exactly that in the demo below. As a bonus, there’s also a slider to adjust the line width and another dropdown to choose the color:
Just to make it 100% clear: this report does NOT need a R server. It is hosted for FREE on github, and it will work even with 1 million ppl connected in the same time!
The Shiny-live documentation is not easy to follow for R users (it targets Python users). But I wrote a recap for you:
⚠️ Limitations
We are still in the early days of webr. A couple of limitations:
🧠 Mental model
I understand that navigating the technology behind webpages can be quite confusing. 😔
However, grasping these concepts is essential to ensure you choose the right tools for your needs.
Below, I've summarized the four main use cases for webpages generated with R. I hope you find it helpful!
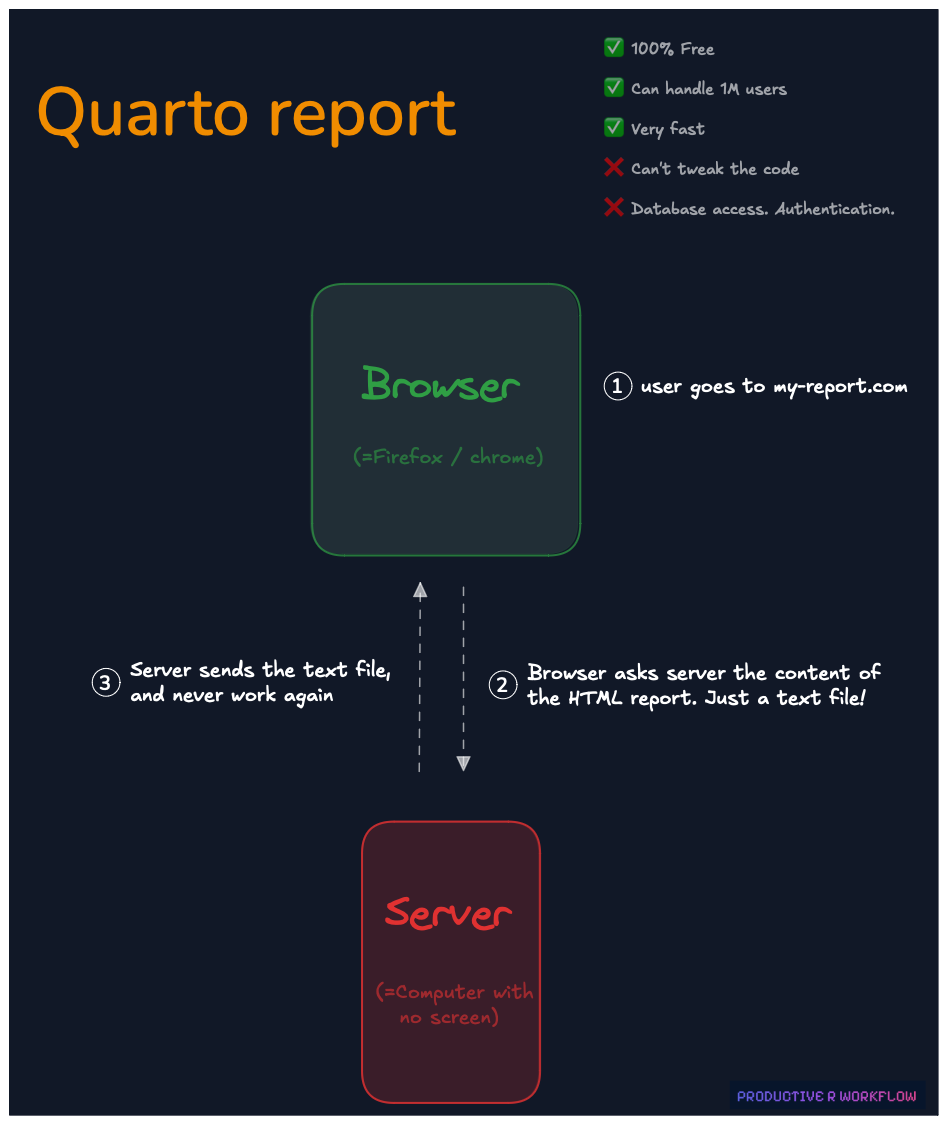
The most simple use case.
You build a HTML file from a .qmd file thanks to Quarto. This file is hosted on a server (on Github for instance).
People can just read this file with their browser. But cannot interact with it.
We call this a static website!