

Parameterized Reports
Imagine you need to generate 100 reports, one for each group of your dataset.
Manually creating and running 100 separate .qmd files isn't ideal. Fortunately, there's a more efficient solution: parameterized reports.
🎁 Problem: You need to create hundred reports
In data science, it's common to run the same analysis across multiple groups, time frames, or parameters to test various hypotheses.
Creating numerous .qmd files for each scenario can quickly become a nightmare. Just imagine having to manually update each file for a simple modification!
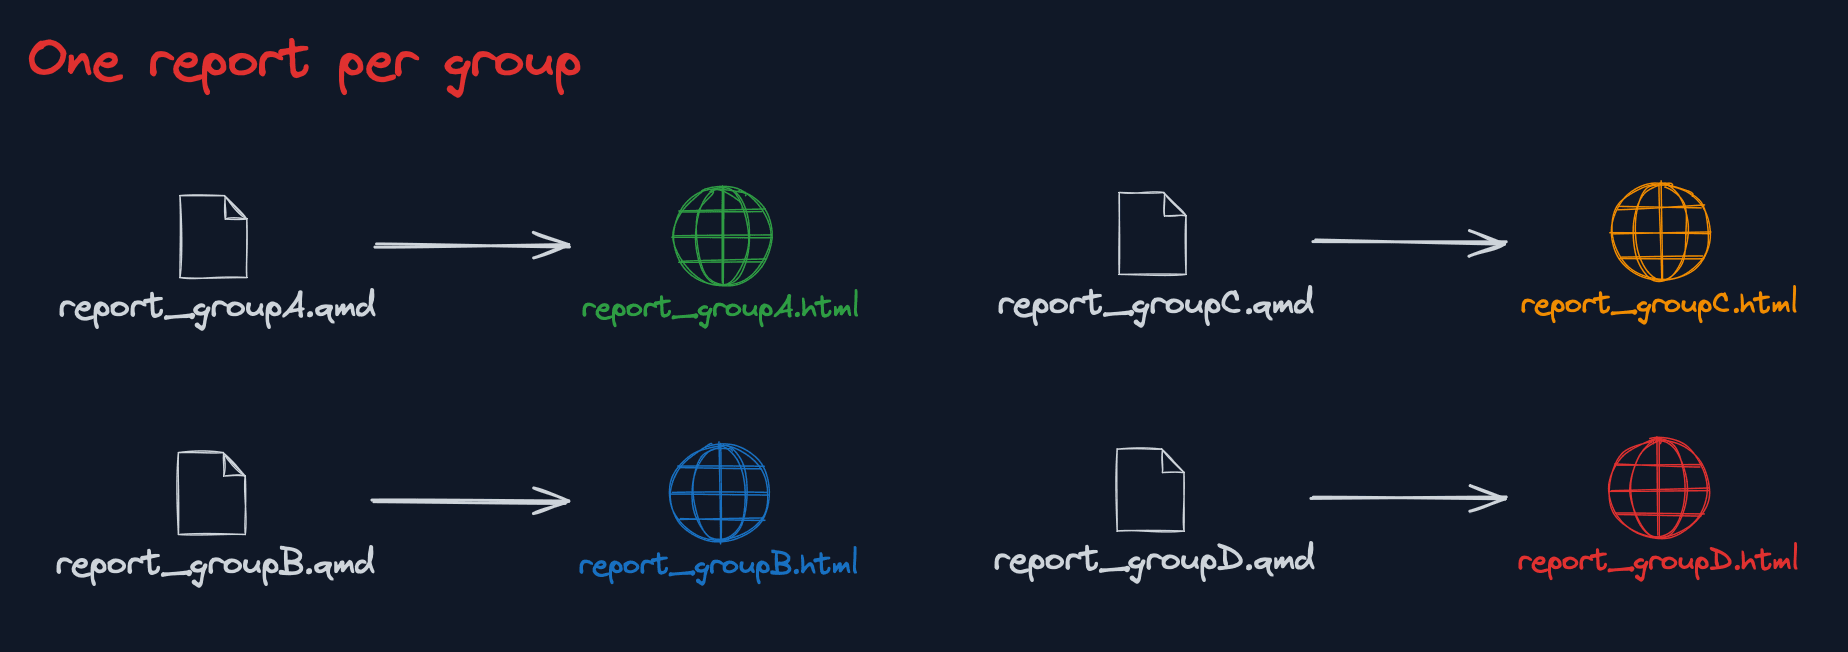
Managing four Quarto reports for the same analysis across different groups is inefficient, repetitive, and increases the risk of errors.
🪄 Solution: Parameterized Reports
A parameterized report is designed to accept parameters and use them to generate its content.
For example, you can create a QMD file that takes a currency name as a parameter. When you knit the document, you pass the currency name to Quarto, and it will be dynamically used throughout the text, titles, and code to perform actions like filtering the dataset for that specific currency.
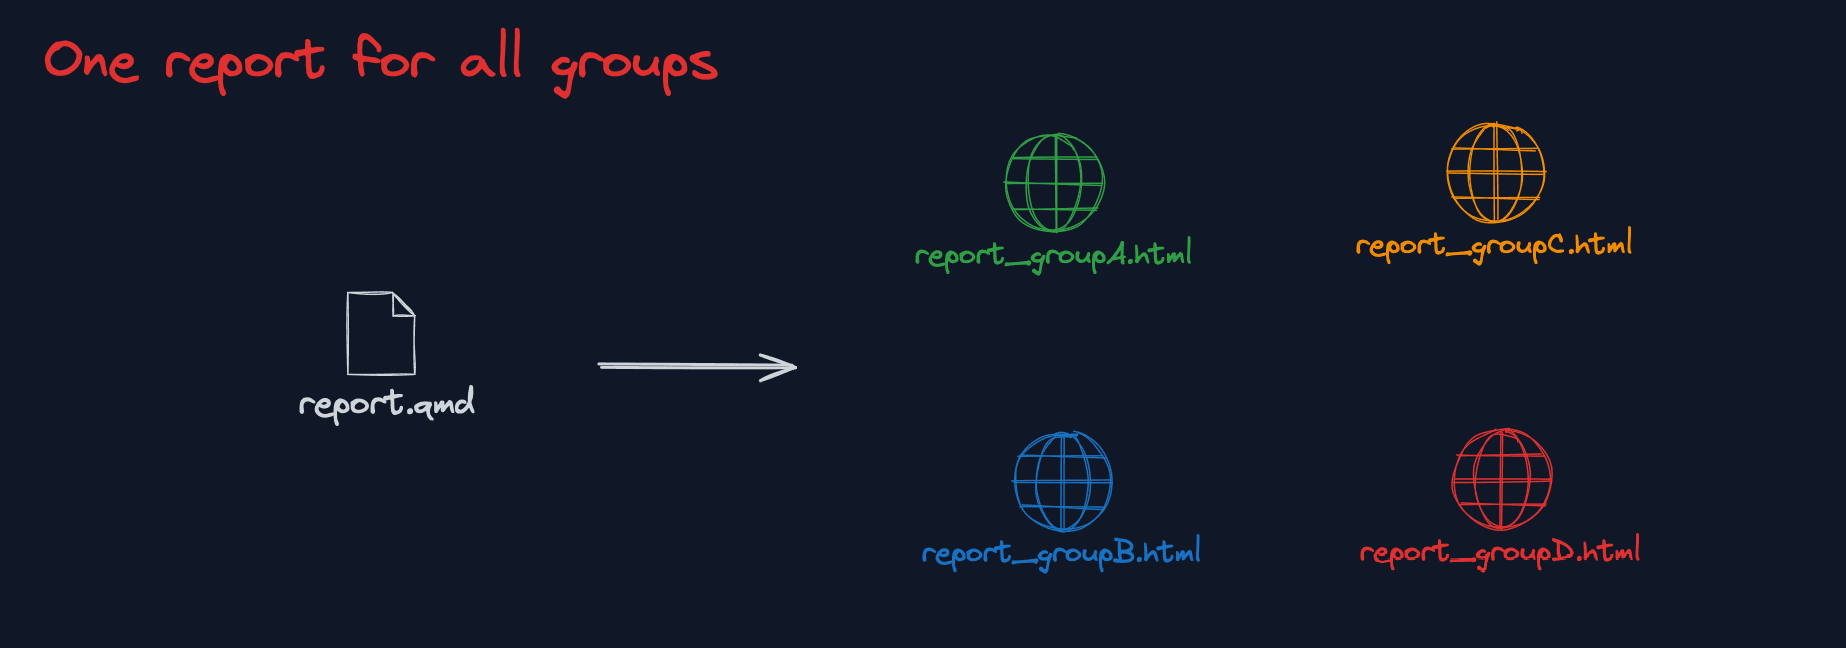
Parameterized reports allow you to use a single QMD file to generate reports for each group, simplifying the process and improving efficiency.
You can then set up a loop to call the report for multiple currencies and produce multiple separate reports, each tailored to a different currency.
→ Here's how to do it:
1️⃣ Add a parameter in the YAML header
Note that you can use any name here. I used crypto, but you can use whatever you want! group, timeFrame, toto, option...
You can use the params option in the YAML header to pass one or several parameters. Each parameter has a name (crypto below) and a default value (bitcoin below).
params:
  crypto: "bitcoin"
2️⃣ Use the parameter in the report
You can use it:
- In the text, using for instance
`r params$crypto` - In a R code chunk using
params$crypto.
Here is an abstract of a QMD file that uses parameters
# Getting data

The `r params$crypto` price can be fetched as follow:

```{r}

# Construct the API URL: root URL + currency name provided as parameter
url <- paste0(
 "https://api.coingecko.com/api/v3/coins/",
 params$crypto
)

```
3️⃣ Render the report & provide the parameter
Now, we need to knit the report once for each currency to generate the HTML files. This is made possible using the quarto_render() R function, which works as follows:
quarto_render(
  input = "report.qmd",
  output_file = "report_bitcoin.html ,
  execute_params = list(crypto = "bitcoin")
)

quarto_render(
  input = "report.qmd",
  output_file = "report_etherum.html ,
  execute_params = list(crypto = "etherum")
)
Here's the breakdown:
quarto_render()is called twice to generate two reports—one for Bitcoin and one for Ethereum.- The
inputargument remains the same: the name of our single QMD file. - The
output_filespecifies the name of the HTML file we want to create. - The magic happens in
execute_params, where we pass the report parameters.
🔥 Pro Tips
🔁 Create a loop
If you have many groups to handle, avoid writing quarto_render() multiple times. Instead, use a loop:
cryptos <- c("bitcoin", "ethereum", "ripple", "litecoin", "cardano")

for (crypto in cryptos) {
  quarto_render(
    input = "report.qmd",
    output_file = paste0("report_" , crypto , ".html"),
    execute_params = list(crypto = crypto)
  )
}
📊 Highlight a group in a chart
It's common in parameterized reports to highlight the specific group targeted by the report on a chart.
This might seem tricky at first, but the solution is to add an extra column that is FALSE for all groups except the target group. Then, use this column in the color argument of ggplot2.
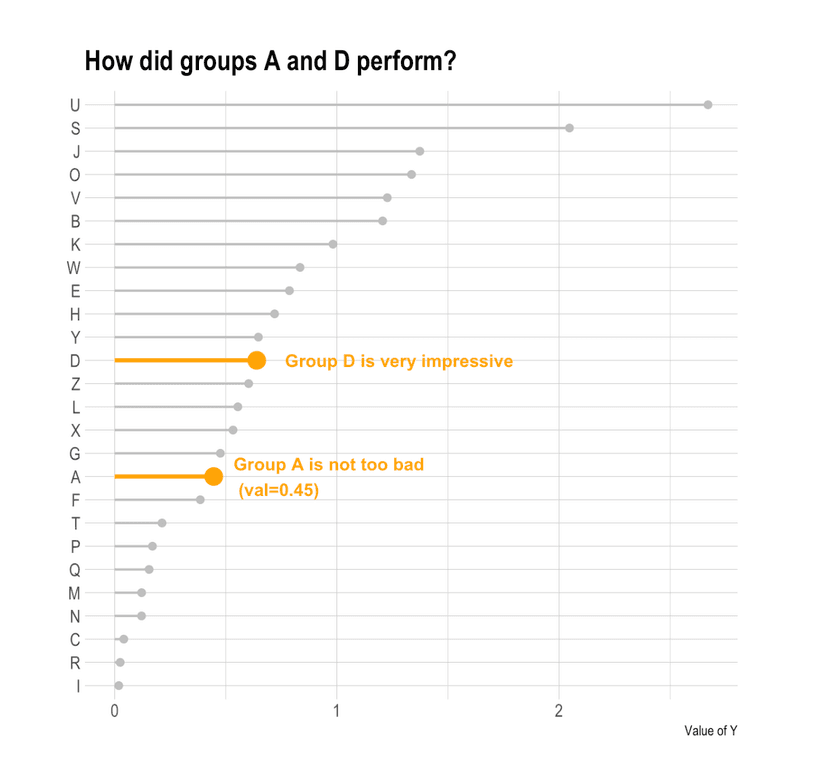
A ggplot2 graph with 2 groups highlighted
I wrote an extensive tutorial in the R graph gallery. Give it a look!
Full Example
I've build a full example to illustrate how this currency project ends up.
- Find the full code on github here
- Check one of the report online here