

Student creations:
A curated collection
This section highlights the work of several students from the Productive R Workflow online course, demonstrating what's achievable after just a few hours of learning.
These examples showcase how to write clean code, create Quarto reports, and host them for free on GitHub.
If you're interested in mastering the creation of data analytics reports with R, join us and start your learning journey today!
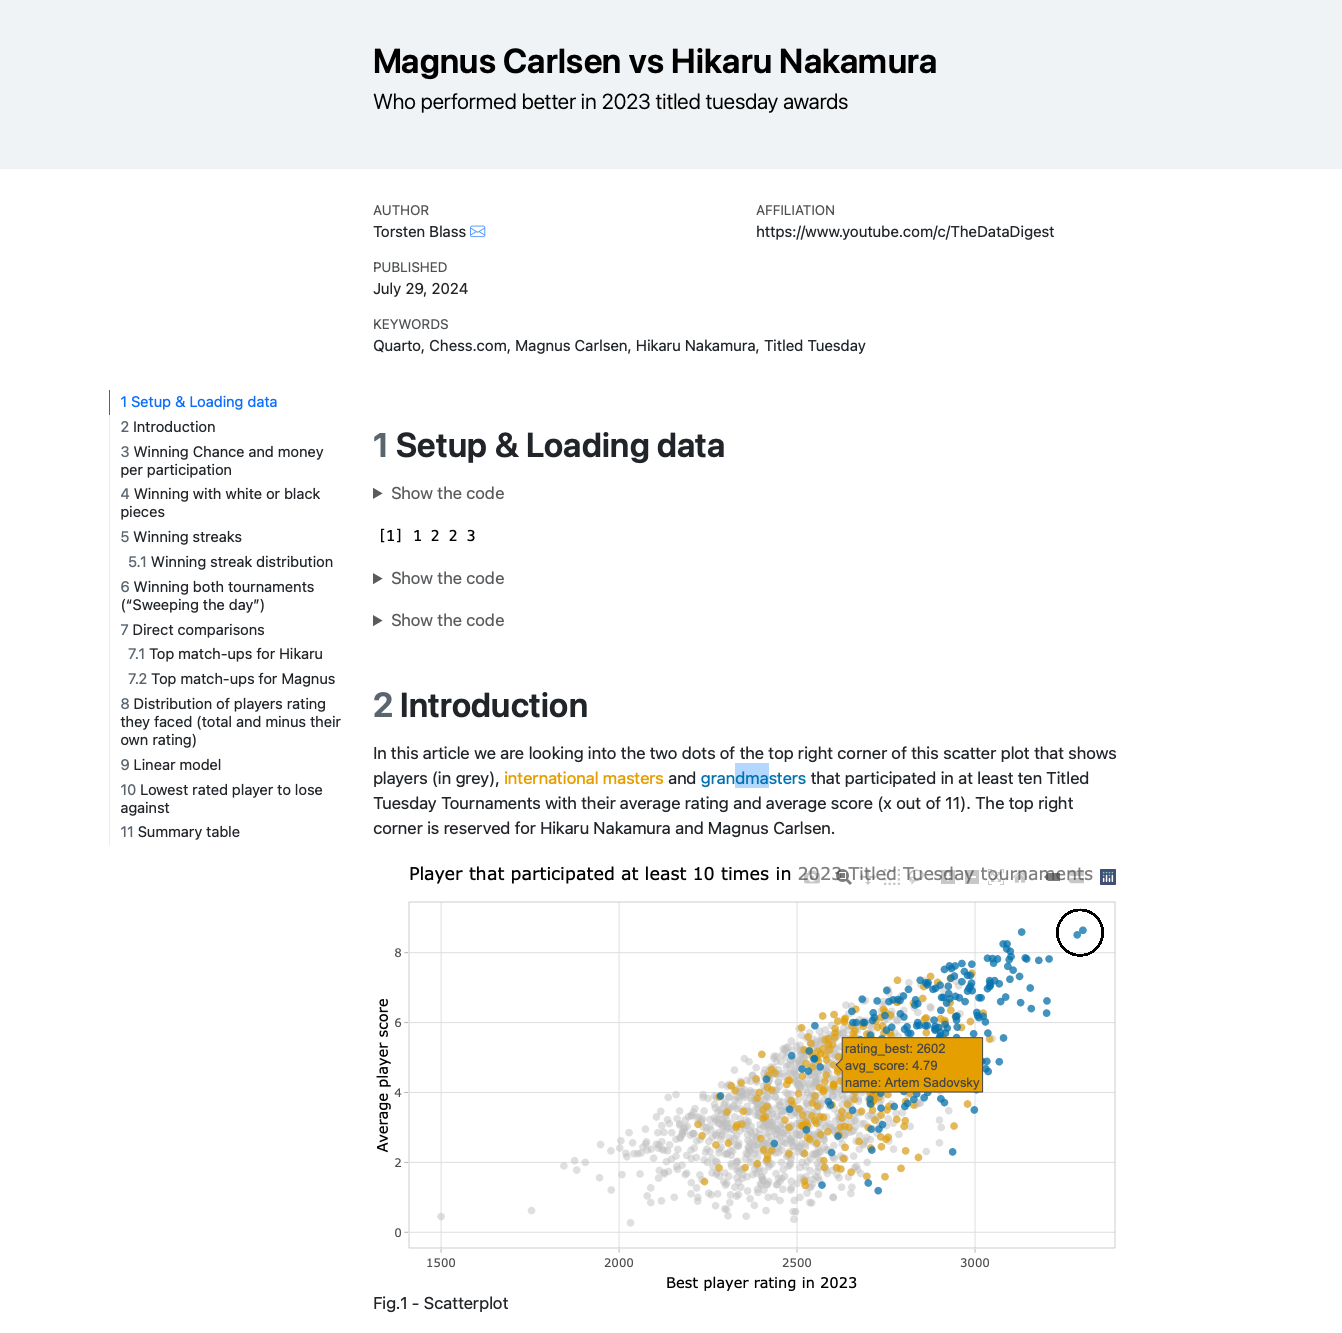
Chess games analysis
Torsten Blass analyzes the 2023 chess games of Magnus Carlsen and Hikaru Nakamura, two of the most renowned players, to determine who performed better.
This report showcases techniques from the course, including interactive graphs, clean headers, text formatting, and code folding.
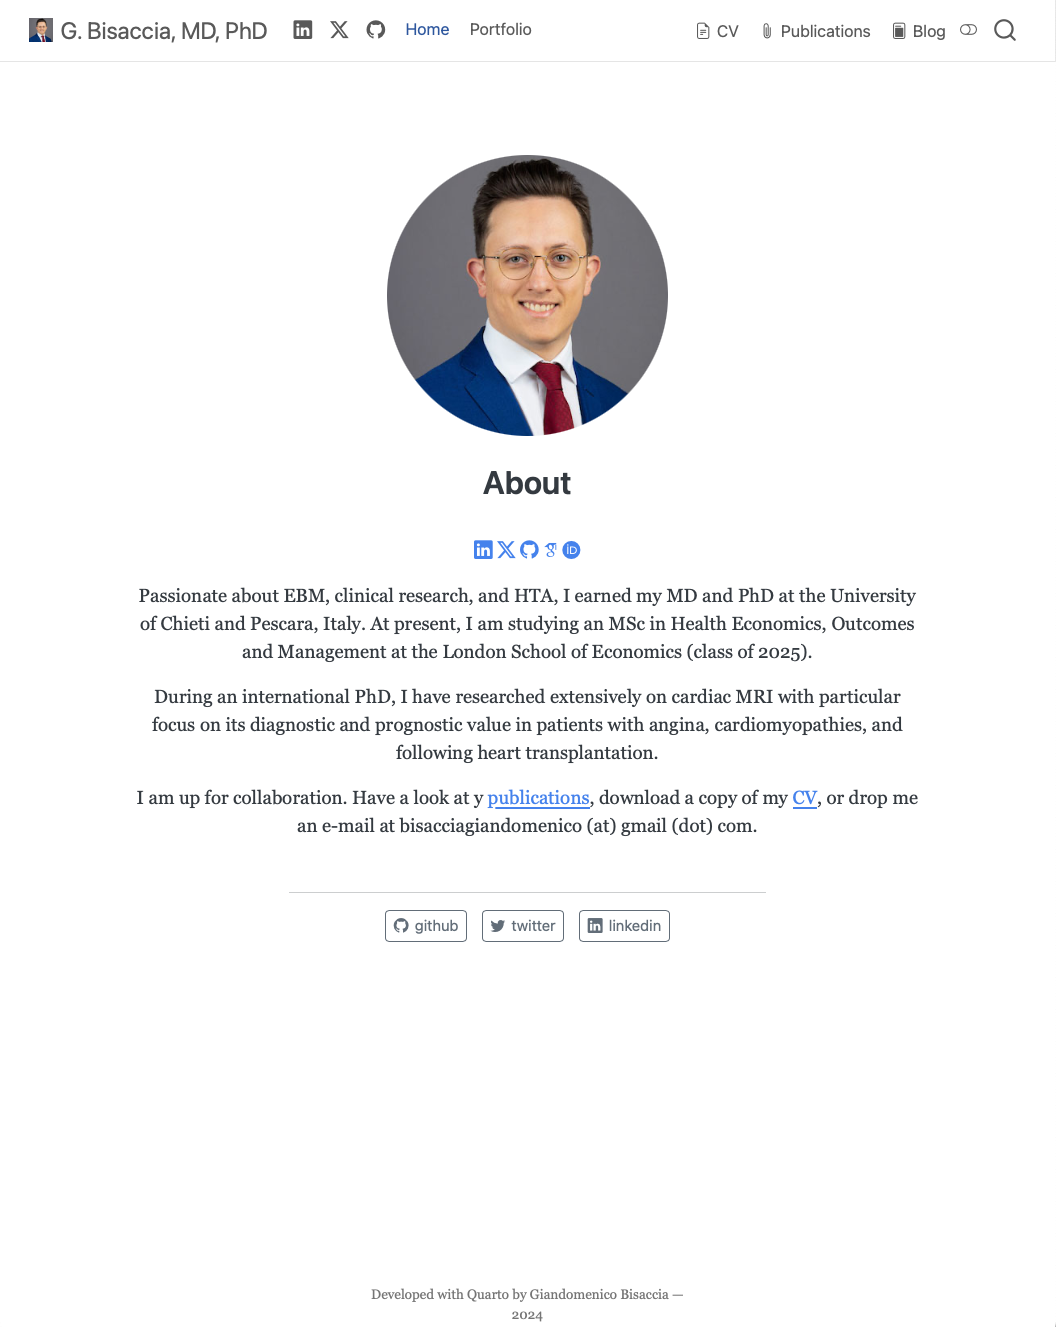
G. Bisaccia's homepage
Giovanni aggregated several quarto pages together to create his homepage.
The result looks good, is hosted for free on github and really easy to update.
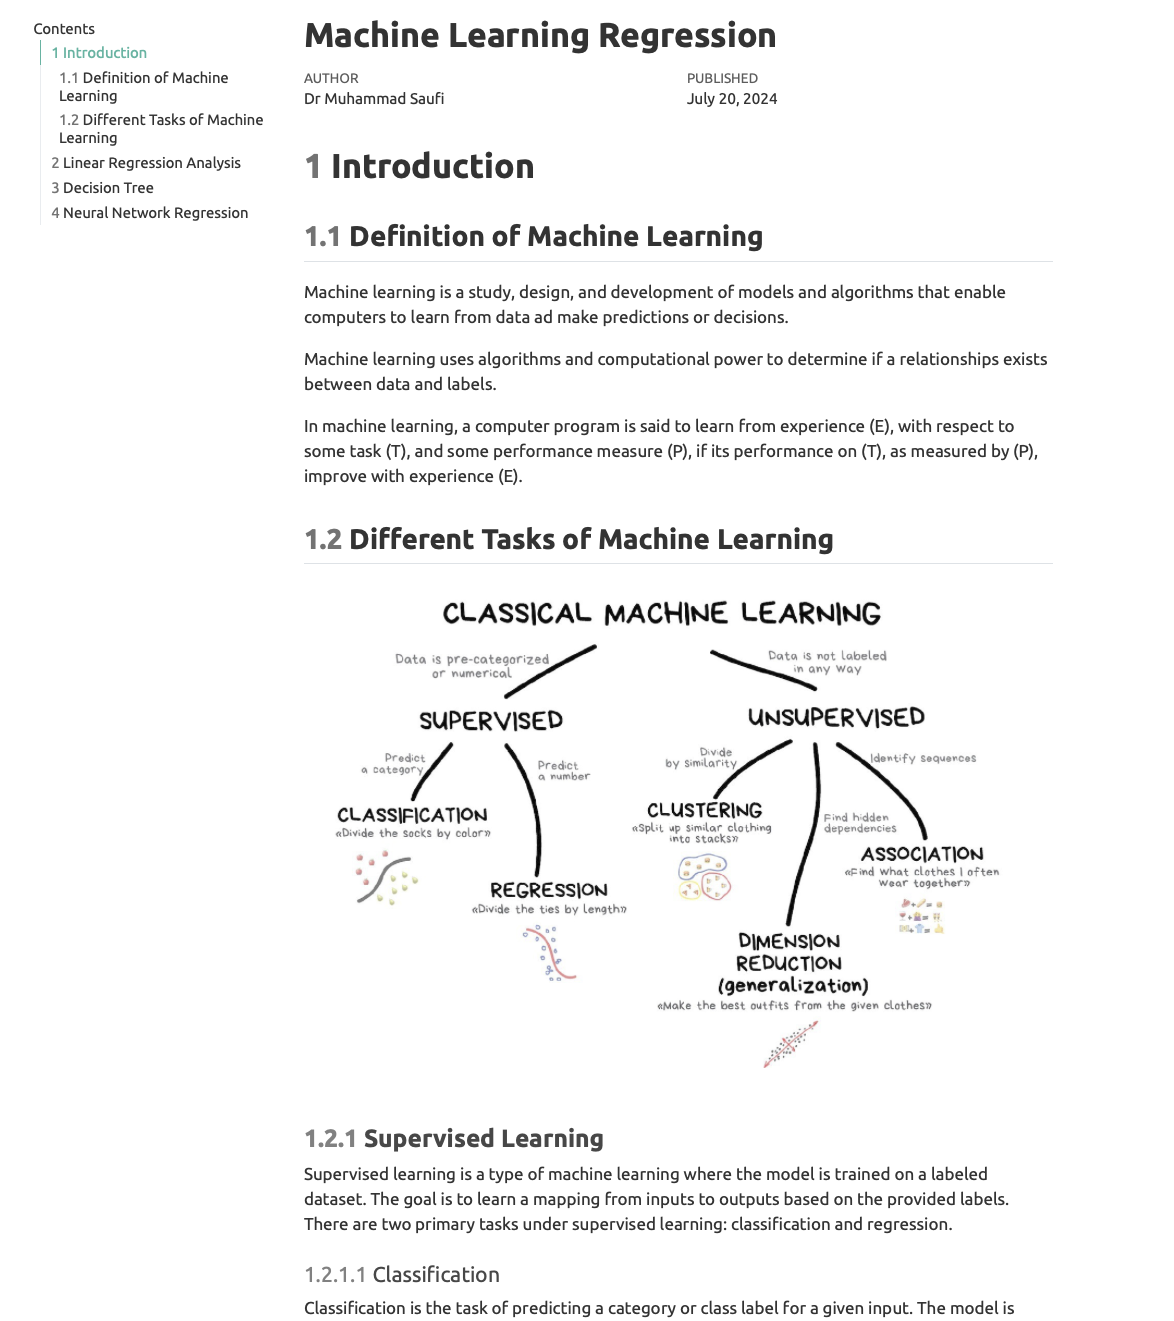
Machine Learning Regression
This notebook explores machine learning and linear regression in depth, with an additional section on decision trees.
Part of a comprehensive series on statistical concepts, this work is created by Muhammad. Check out his GitHub page!
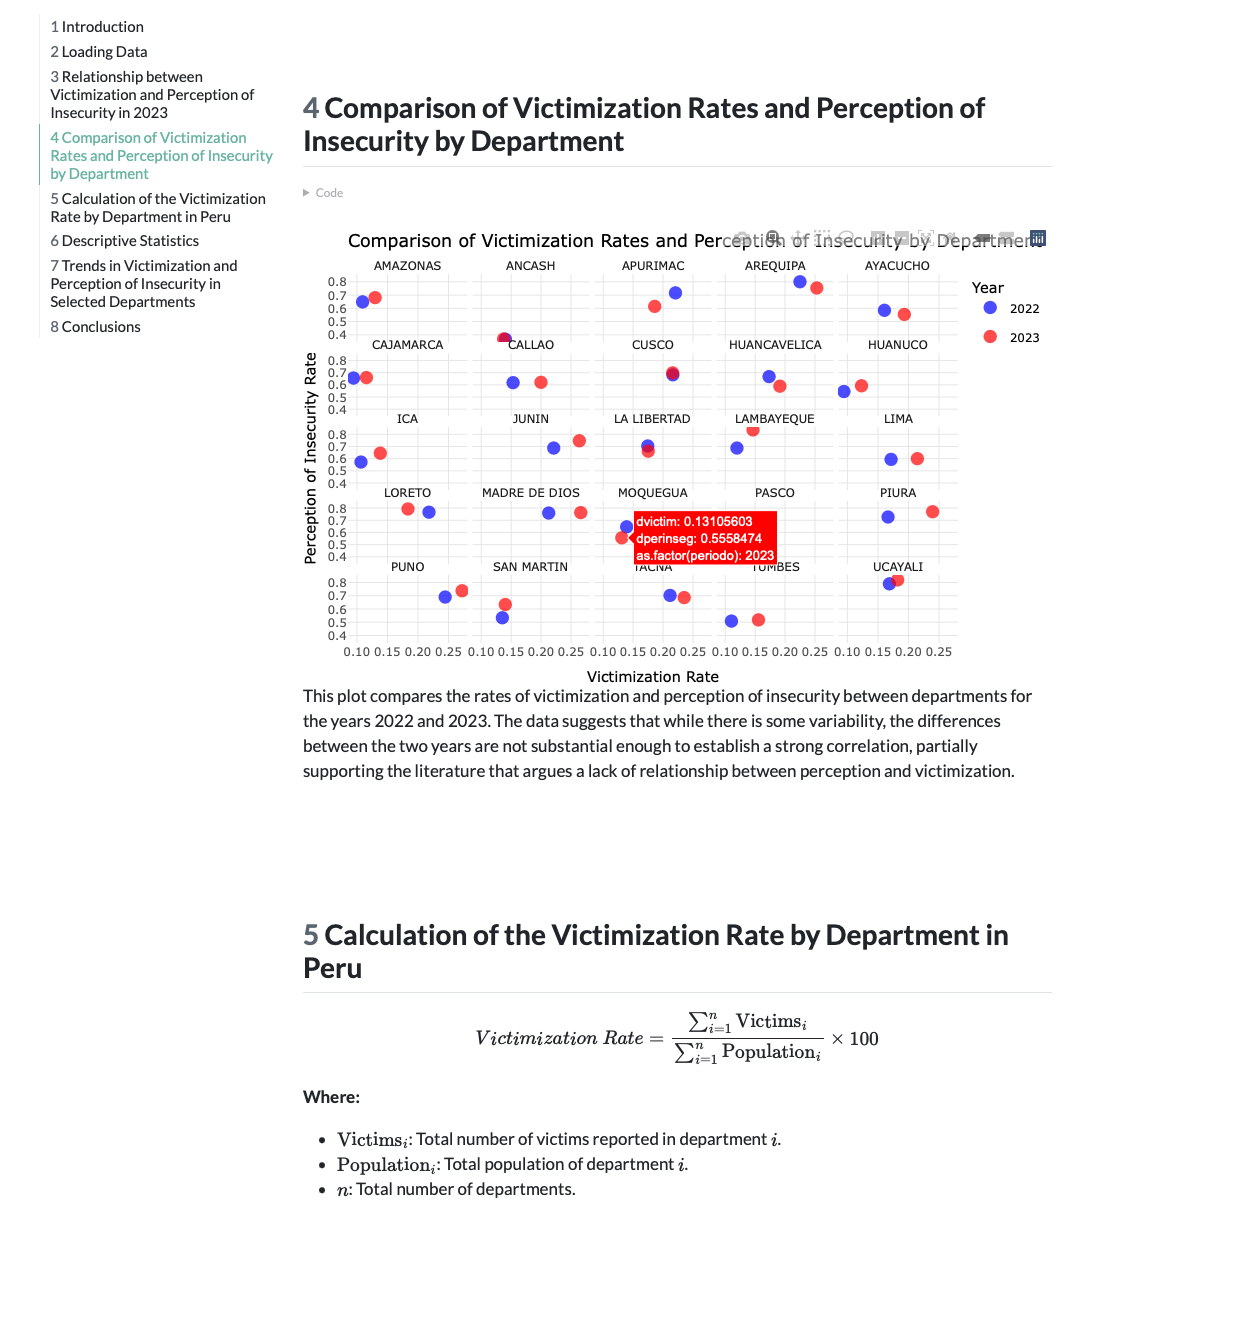
Citizen Security in Peru
A descriptive analysis of the citizen security in 2022 and 2023 in Peru. It including victimization rates, perception of insecurity, and home burglaries by department
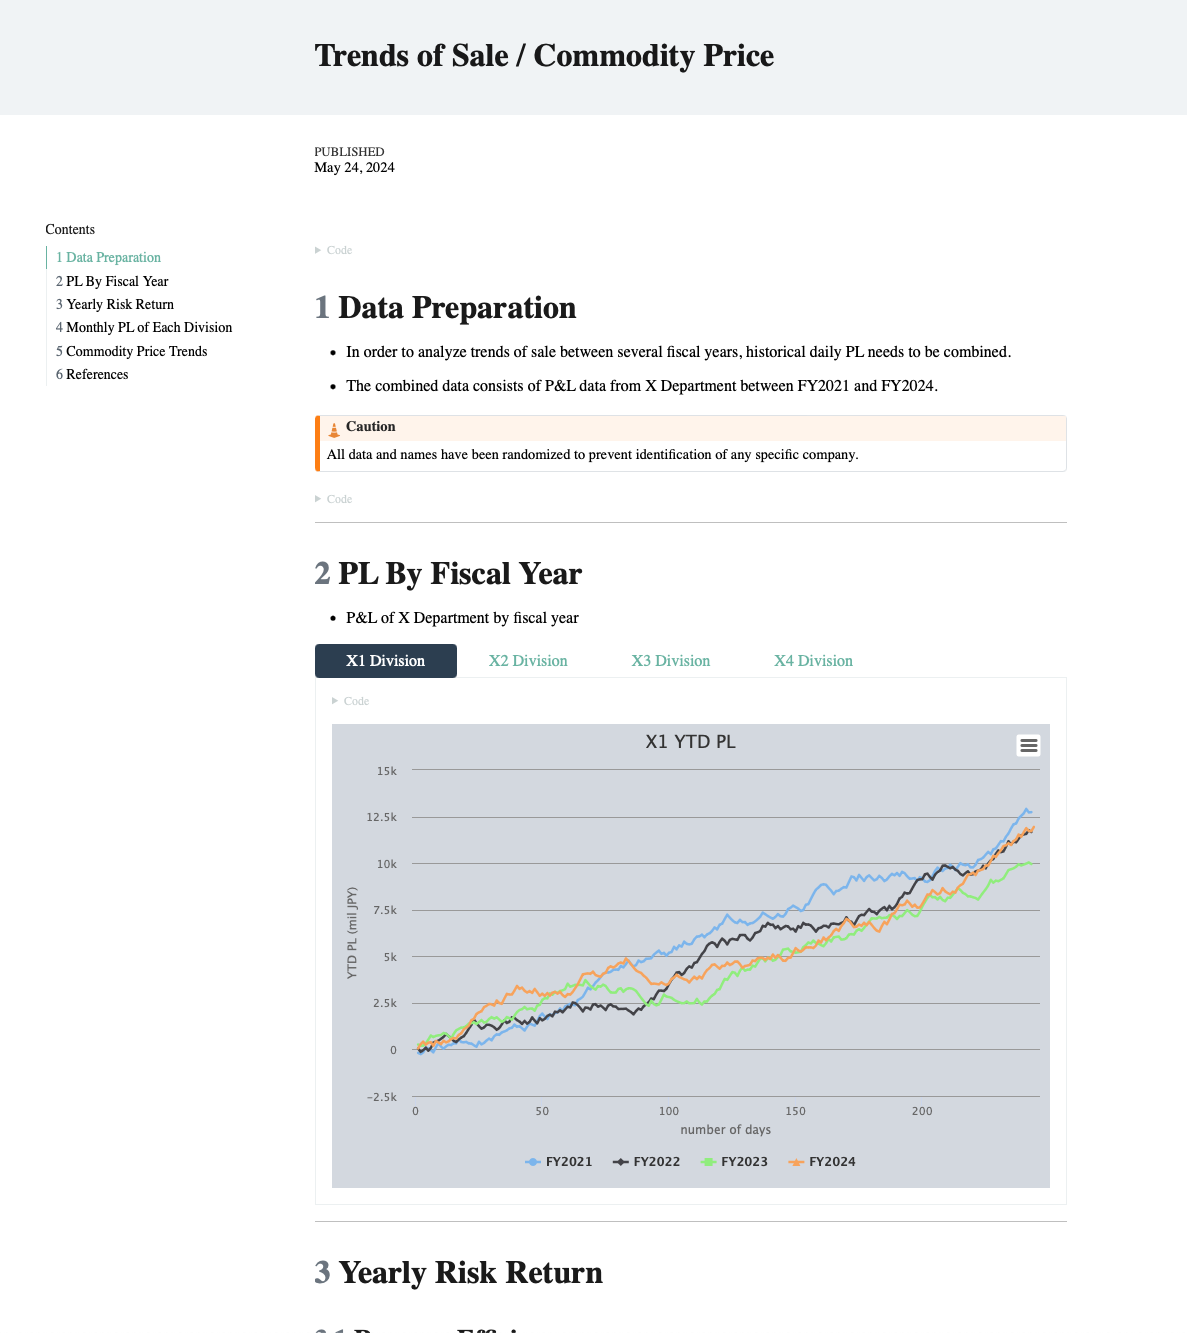
Trends of Sale
Analysis of sales trends and commodity price fluctuations across multiple fiscal years.
I love that multiple graphs are available using tabs in the report 😍
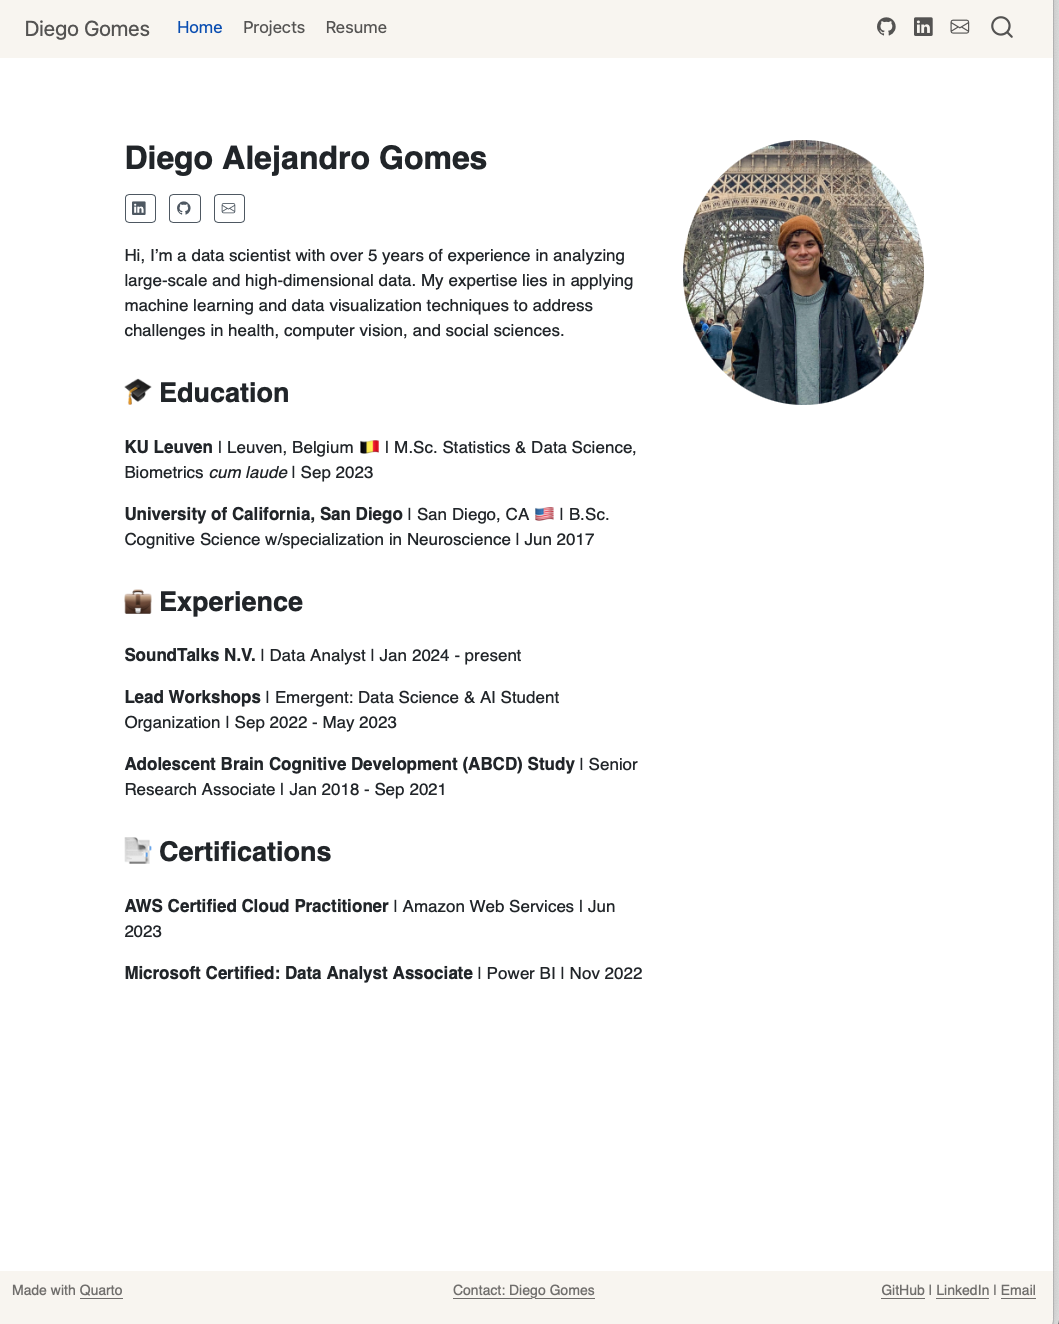
Diego's homepage
Diego used Quarto and Github to create his homepage and host it for free.
Looks sleek and professional! 👏
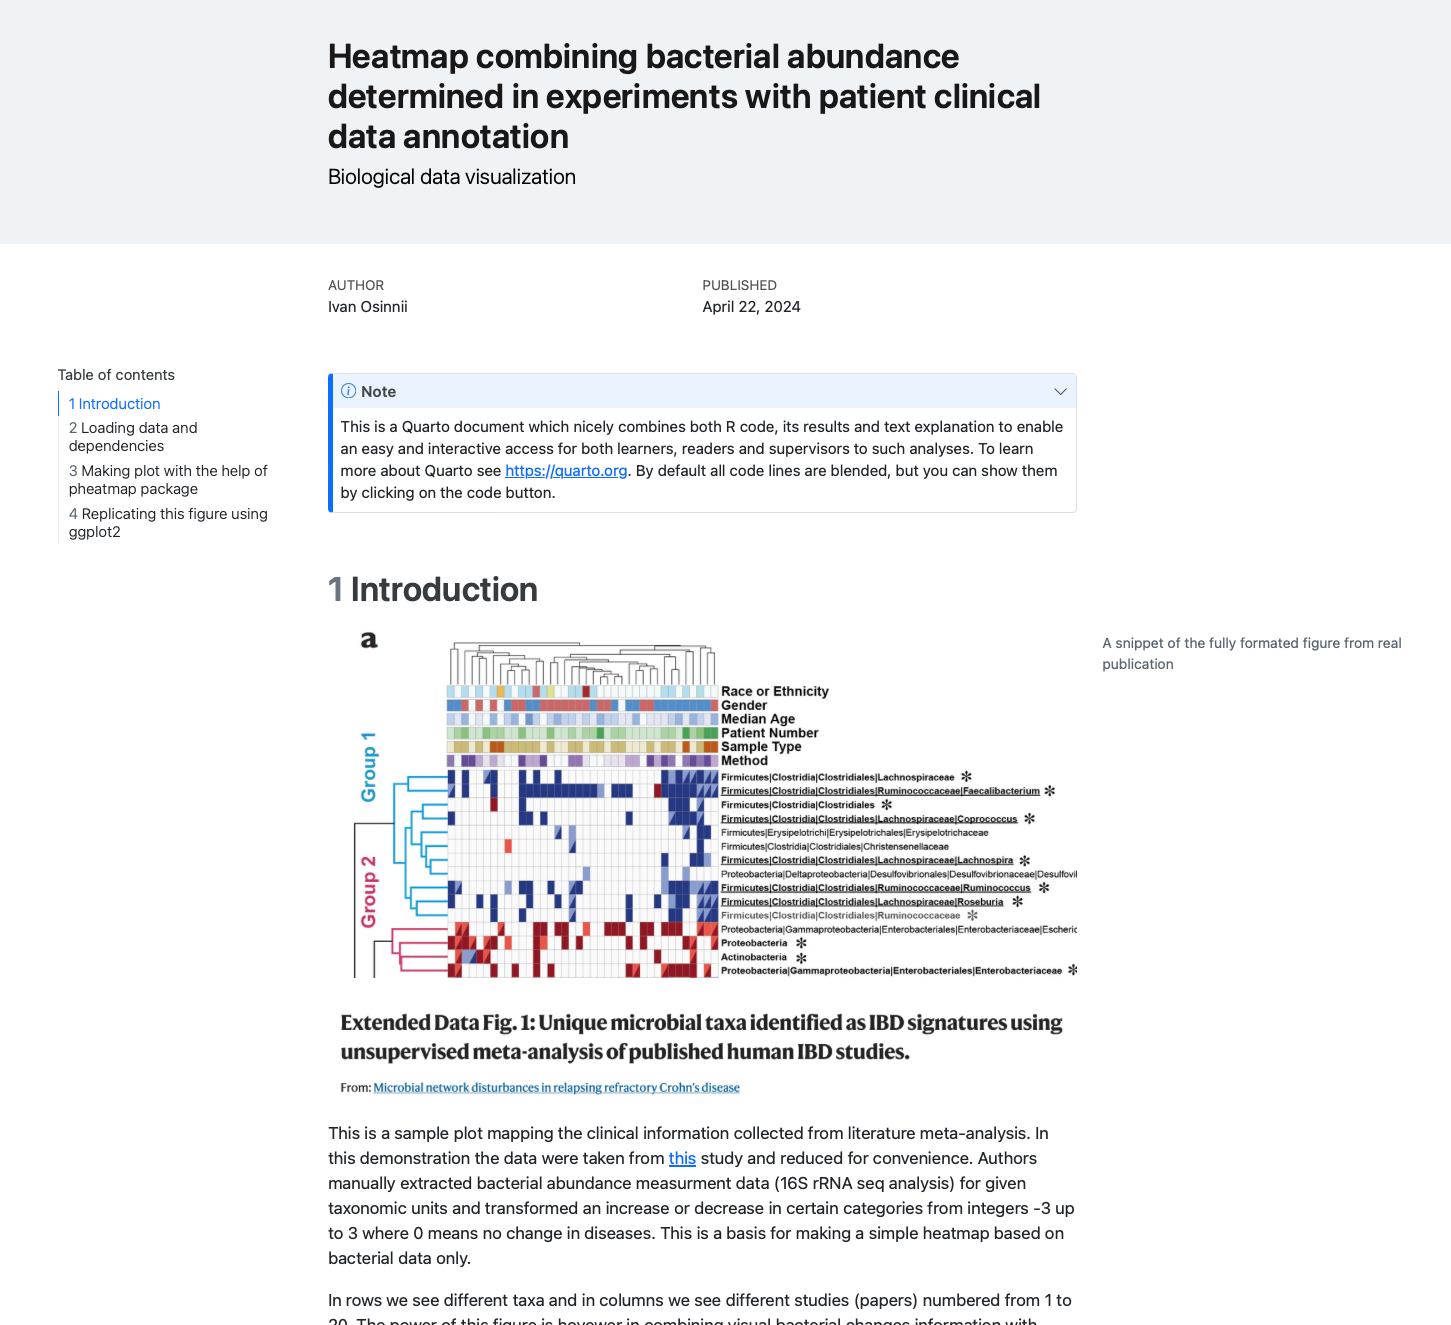
Bacterial abundance
A set of heatmaps combining bacterial abundance determined in experiments with patient clinical data annotation.
Heatmaps are made using pheatmap and ggplot2.
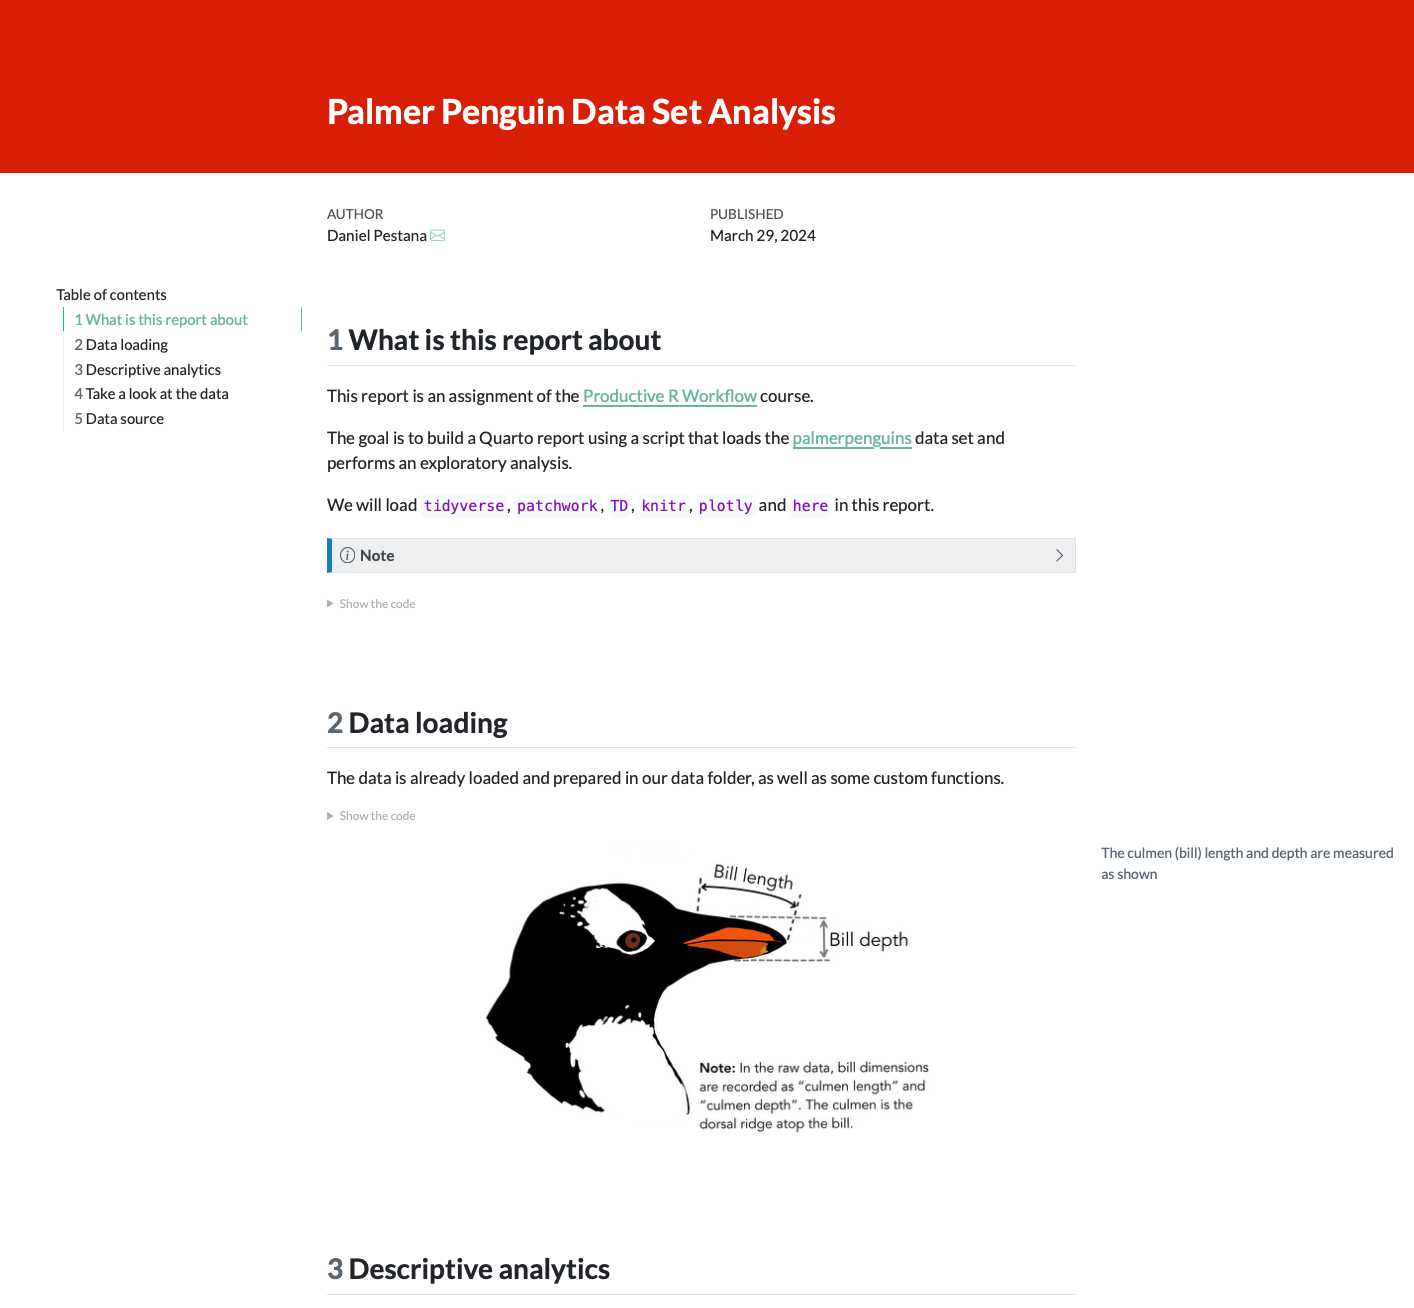
Palmer Penguin
Daniel personalized a bit the Penguin project that students build all along the course.
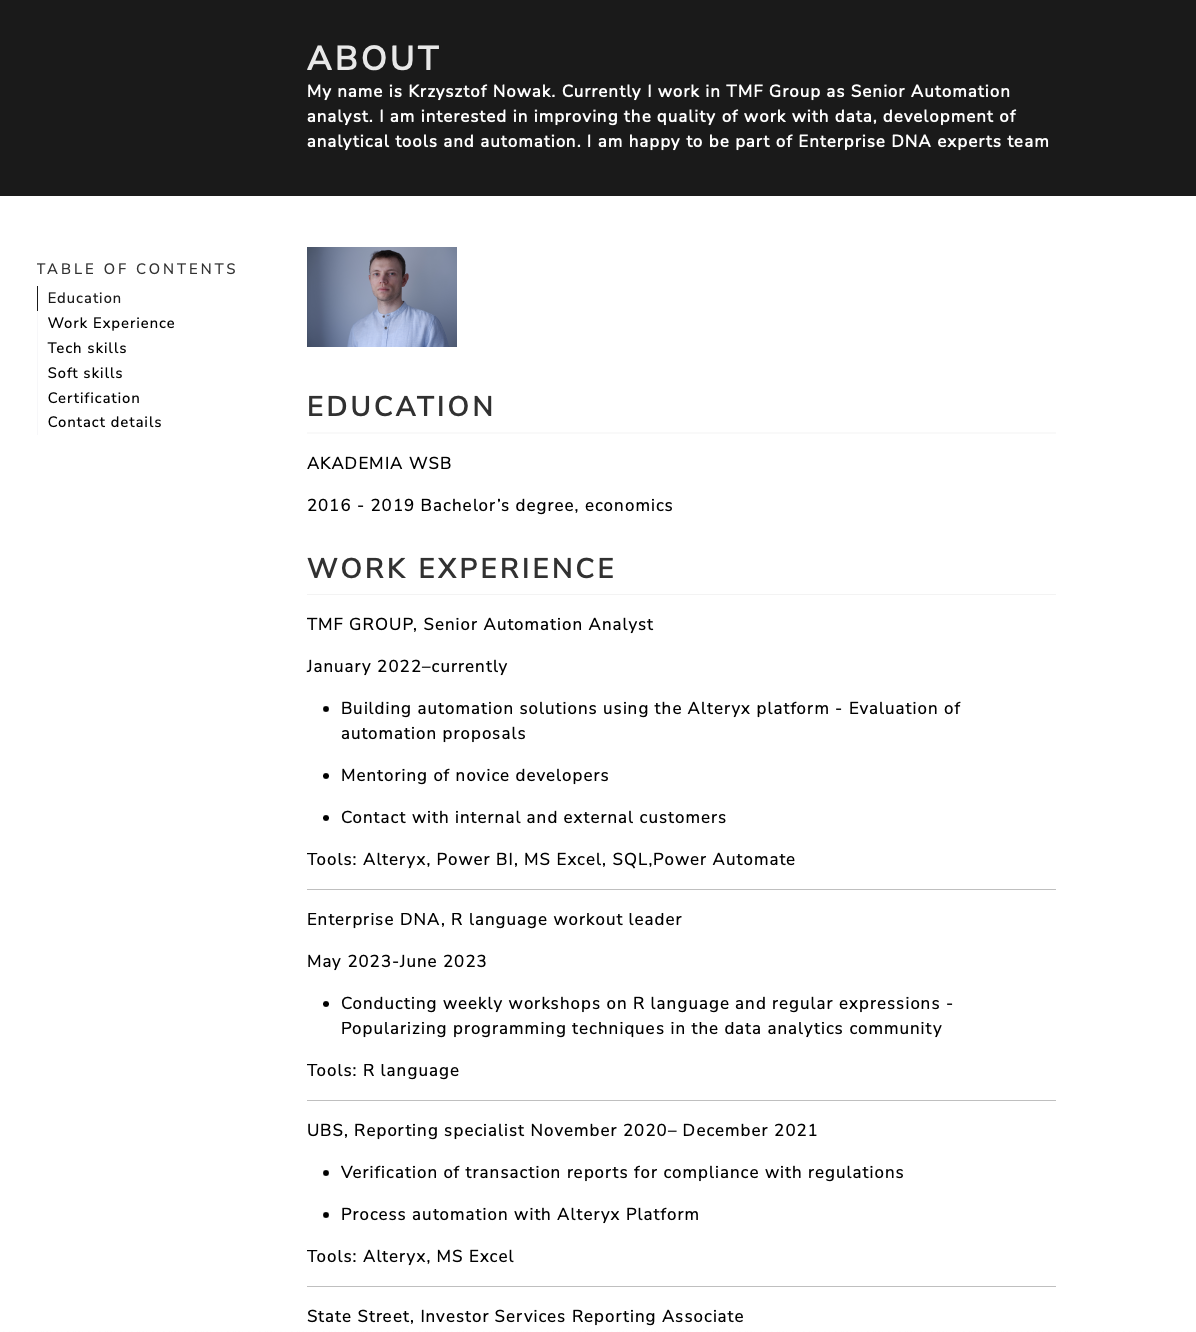
Krzysztof's homepage
One more homepage created by Krzysztof Nowak.
This one is very simple yet efficient. It's a one-pager that gives everything you need about Krzysztof's profile.
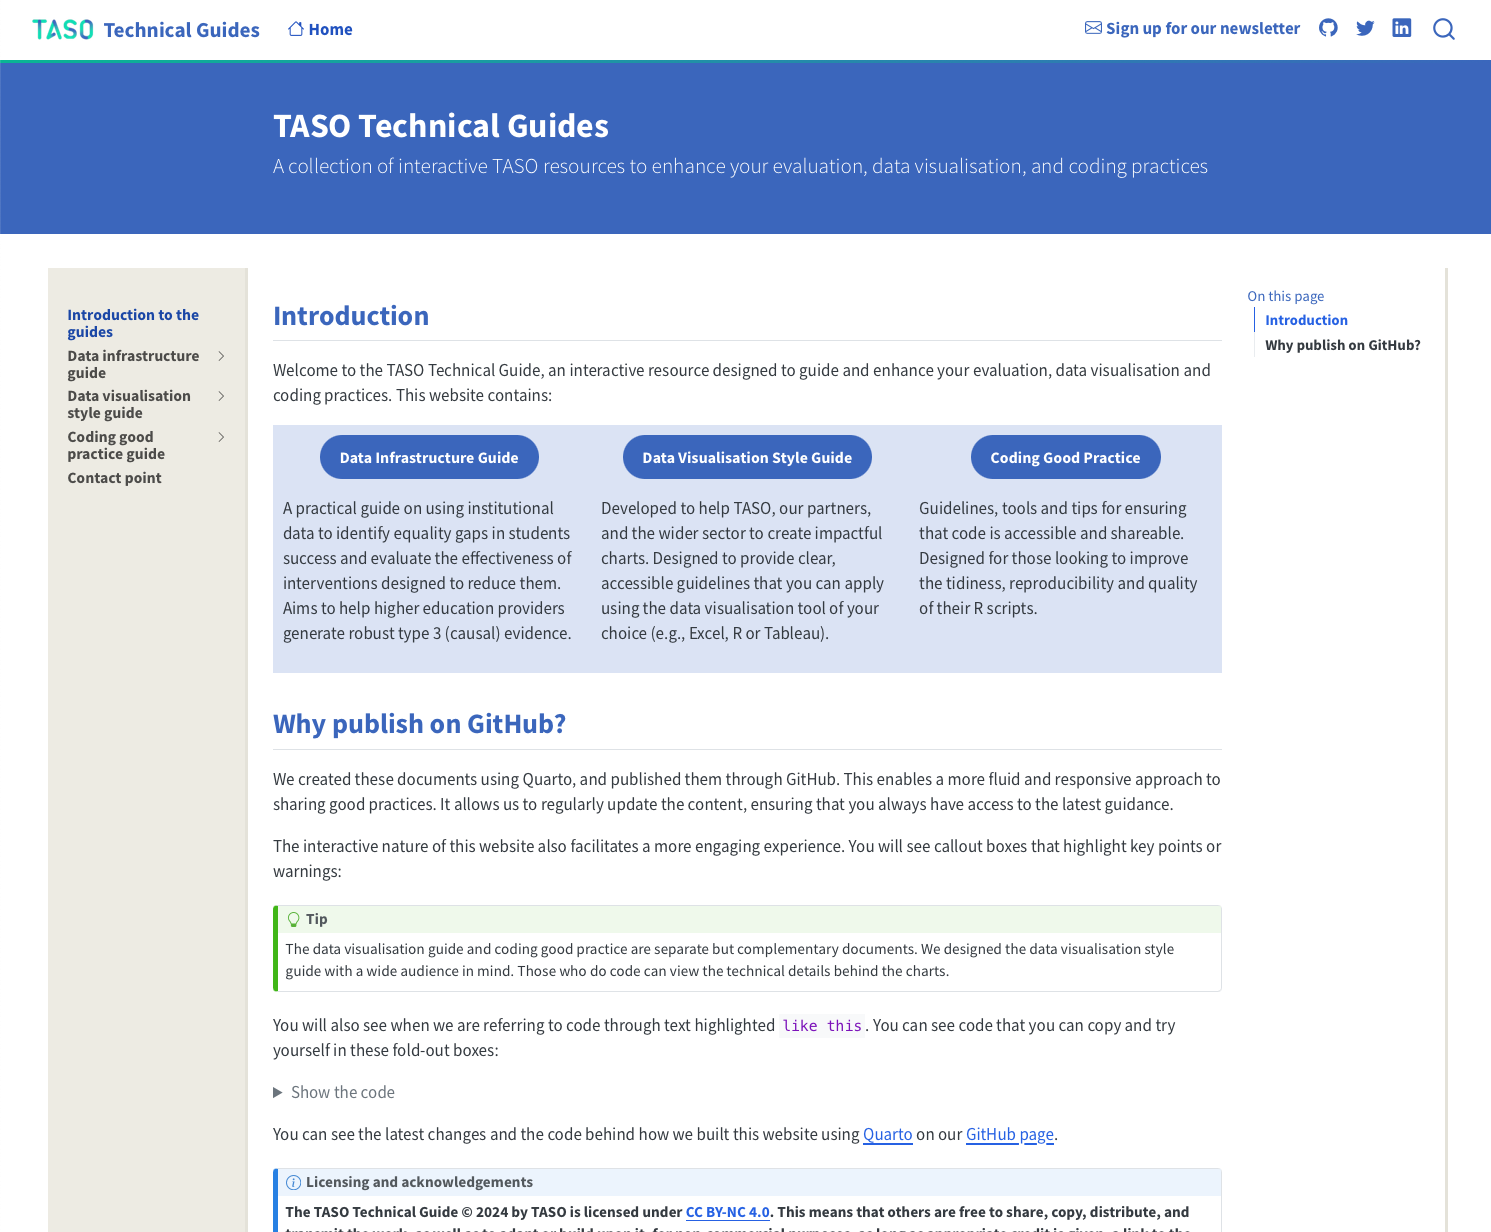
TASO Technical Guides
An interactive resource designed to guide and enhance users evaluation, data visualisation and coding practices for the TASO project.
A full website built with Quarto!

Hogan Lab Homepage
Homepage of the Hogan's lab which studies pediatric morbidity and mortality through the lens of social determinants of health